Alcohol Ban, and crime in Bihar: Not much to see here
Introduction
A few days back, a couple of newspapers carried articles based on this report on how crime rates in Bihar had increased steadily following the alcohol ban. The claim was definitely surprising and worth a deeper look.
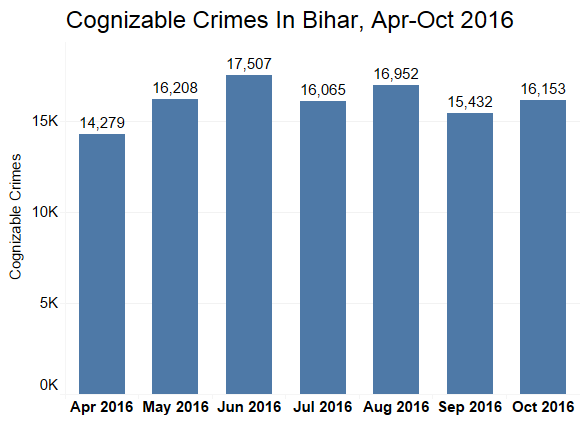
The central claim of rising crime post the April ban of alcohol was made citing the following graph, generated from figures obtained from the Bihar police. The author compared the total crime figure of 14,279 in April, 2016 to 16,153 in October, 2016 to arrive at a difference of around 13% which was recorded as the increase in crime post the alcohol ban.
Before we rule this shift as the result of the alcohol ban, we need to have a sense of what the crime figures for October, 2016 would have been if the ban had not happened. A rough and dirty method to get this sense is to look at how crime figures in Bihar behaved before the ban.
Year-on-Year Comparison
If the alcohol ban did indeed impact the crime figures, we would expect the crime figures for each month after April, 2016 (when the alcohol ban came into effect) to be significantly higher than the figures for the corresponding months in 2013, 2014, and 2015. The following graph performs this comparison for us. The graph shows the total cognizable crimes committed in Bihar in each month of the year for the 2013-2016 period.
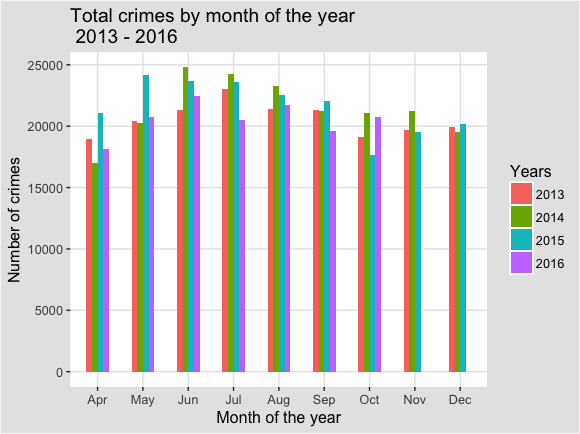
The crime figures for each month after April, 2016 are roughly similar to the figures for the 2013-2015 period. In fact, the figures for 2016 are lower than the figures for 2015 in all months except October. Only in April and May are the 2016 figures higher than the 2014 figures as well. It appears that October 2016 is a slight outlier in terms of the past trend.
The above relationship is also seen in the case of the major individual crimes in Bihar. The following graphs indicate the Year-on-Year month-wise comparison for thefts, riots, kidnapping, and burglary, respectively. Only the trend for kidnapping shows a wide deviation from the 2013-2015 trends.
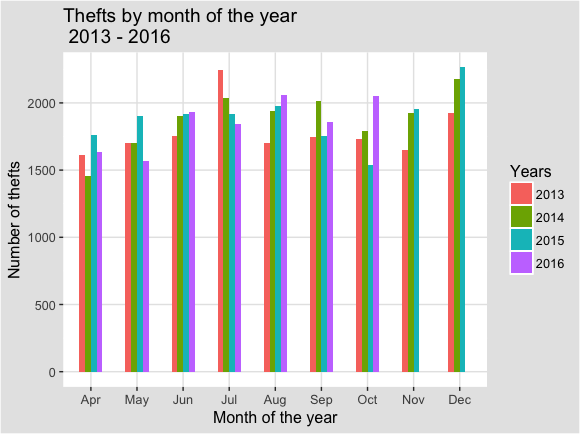
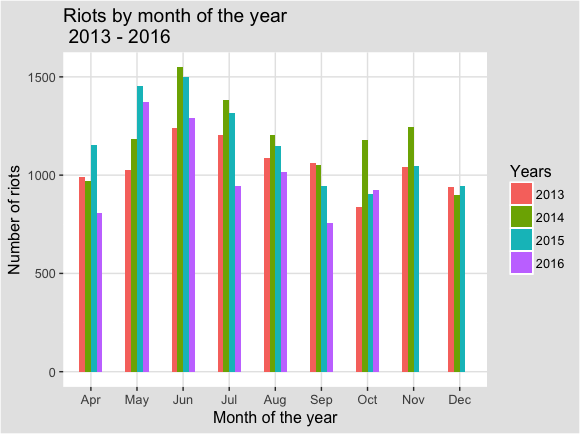
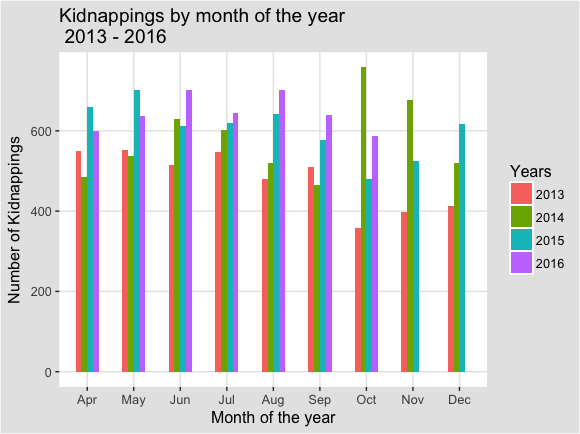
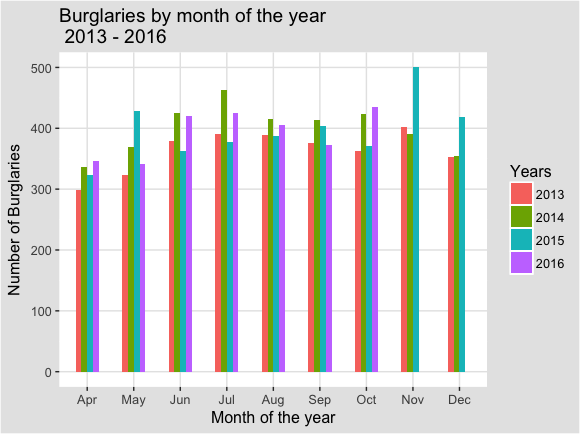
All this seems to indicate that the post-April, 2016 period is not significantly different from previous years, and the alcohol ban has not had a major impact on crimes.
Seasonality of crimes
A general reason for the above results is the seasonality of crime in Bihar- meaning crime is generally higher in some months, and lower in others. This is highlighted by the following graph, which shows the average crime figure for each month of the year for the 2010-2015 period.
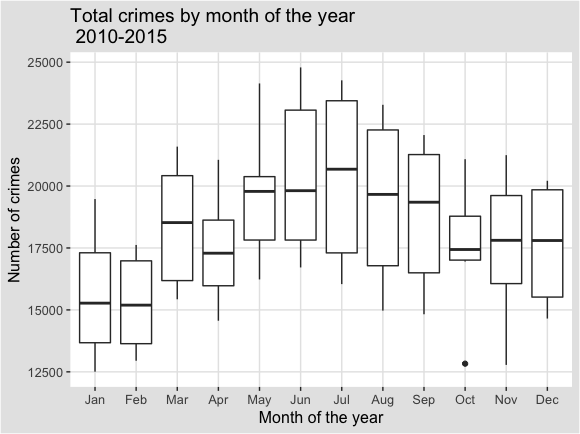
The difference between months is clearly visible. A comparison of the crime figures in January or February against any other month will most likely lead us to conclude that crime had increased.
However….
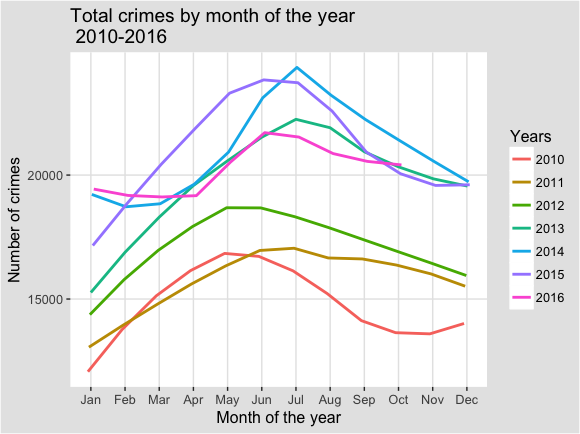
None of this means that all is well in Bihar. In fact, as the following figure indicates, the monthly crime figures for the period 2013 - 2016 are consistently higher than the figures for 2010 - 2012. While these figures are unadjusted for population figures (per-capita crime could be decreasing, even though absolute crime is increasing) as well as for possible periodicity in crime (crime may rise and fall over cycles of 3 or so years), the persistent upward shift of crime figures deserves closer scrutiny.
Notes and References
- The code (a bit messy) and the data (relatively clean) used to generate the figures are available here.